Case Study: Prototyping the Future of Underwriting
Today’s companies face the challenge of transforming data into valuable insights and actionable knowledge. While new technologies promise support, the use case ultimately determines whether and how these emerging technologies reveal their business value.
Background
Large insurance companies possess vast amounts of datasets, including customer data, statistics on various topics, and documented use cases. These data hold the potential to generate knowledge, learn from patterns, and make informed decisions. However, much of this data resides in legacy architectures, hidden in massive databases, and is often heavily guarded and only available for very direct evaluations. This diminishes their value, as many business-relevant insights emerge through new connections. The vision: What if employees, in this case underwriters, had easy access to these data lakes, could interact with user-friendly tools and gain their own insights to make their daily work faster and better informed?
The Challenge
Our client, a major reinsurance company, requested support in implementing graph-based databases, which allow for data architectures with extreme and highly flexible networking capabilities. This technology, known as Knowledge Graph, currently primarily appeals to data scientists and analysts, making it far from accessible to underwriters, happy to have digital tools more convenient and powerful than excel. Of course, using Knowledge Graph technology to search through companies' data lakes enables underwriters to learn more about the context of their cases, if they can use this technology and integrate it easily into their workflow. But it quickly became apparent that people were having serious difficulties doing just that.
Initial Analysis
During project analysis and context exploration, it quickly became apparent that the real challenges lay in:
Identifying processes that could be improved through these new systems
Determining the necessary changes to adapt these processes to the technology's capabilities and vice versa
While enthusiasm for this knowledge system was high, but integrating it seamlessly into daily business routines was complicated.

Strategic Shift
After evaluating our analysis results, we informed the customer that this was not about an improved user interface, but that real added value can only be achieved if these technologies can be integrated into the routines of their users. We successfully convinced them to provide a budget for exploration focused on:
Exploring the possibilities of graph-based databases for the underwriting business
Prototypical development of future use cases concerning underwriting jobs
Design of accessible and user friendly interfaces for the technology
Project Goals
Examine classic underwriter use cases
Meaningfully integrate the technology into these use cases
Support, accelerate, and simplify complex activities
Investigate whether this technology could address known challenges and problems
Visualize scenario results in simple prototypes
Make them interactively accessible for relevant use cases
We systematically:
Captured underwriter use cases through interviews
Documented requirements through close feedback loops
Mapped associated work processes
Began designing creative solutions
Complexity Management
The management of complexity emerged as the primary challenge. Unlike classical applications, a Knowledge Graph represents an approach to implementing a learning system that can be highly individualized. Users want to ask questions of their data and receive faster, higher-quality answers from the system.
Interface Innovation
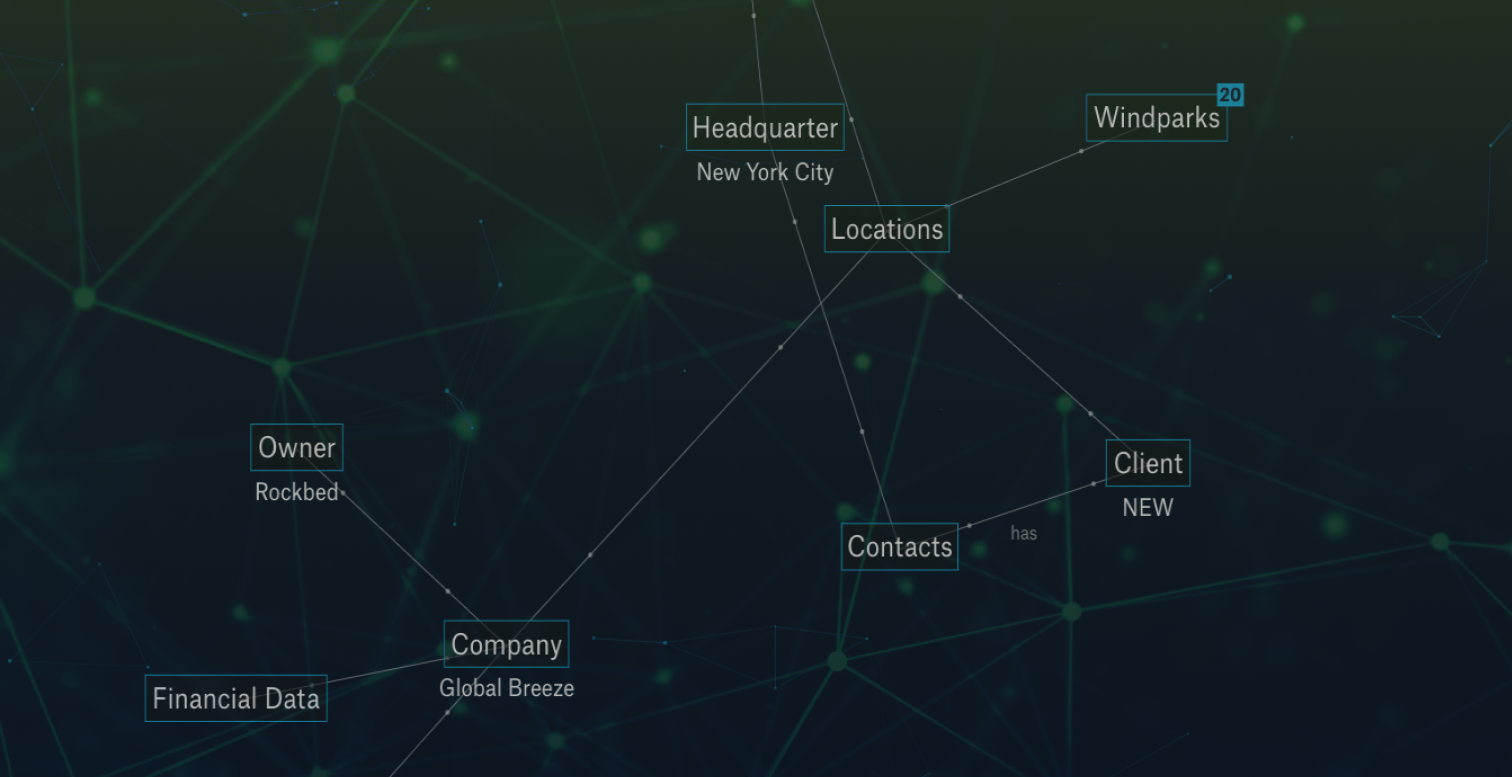
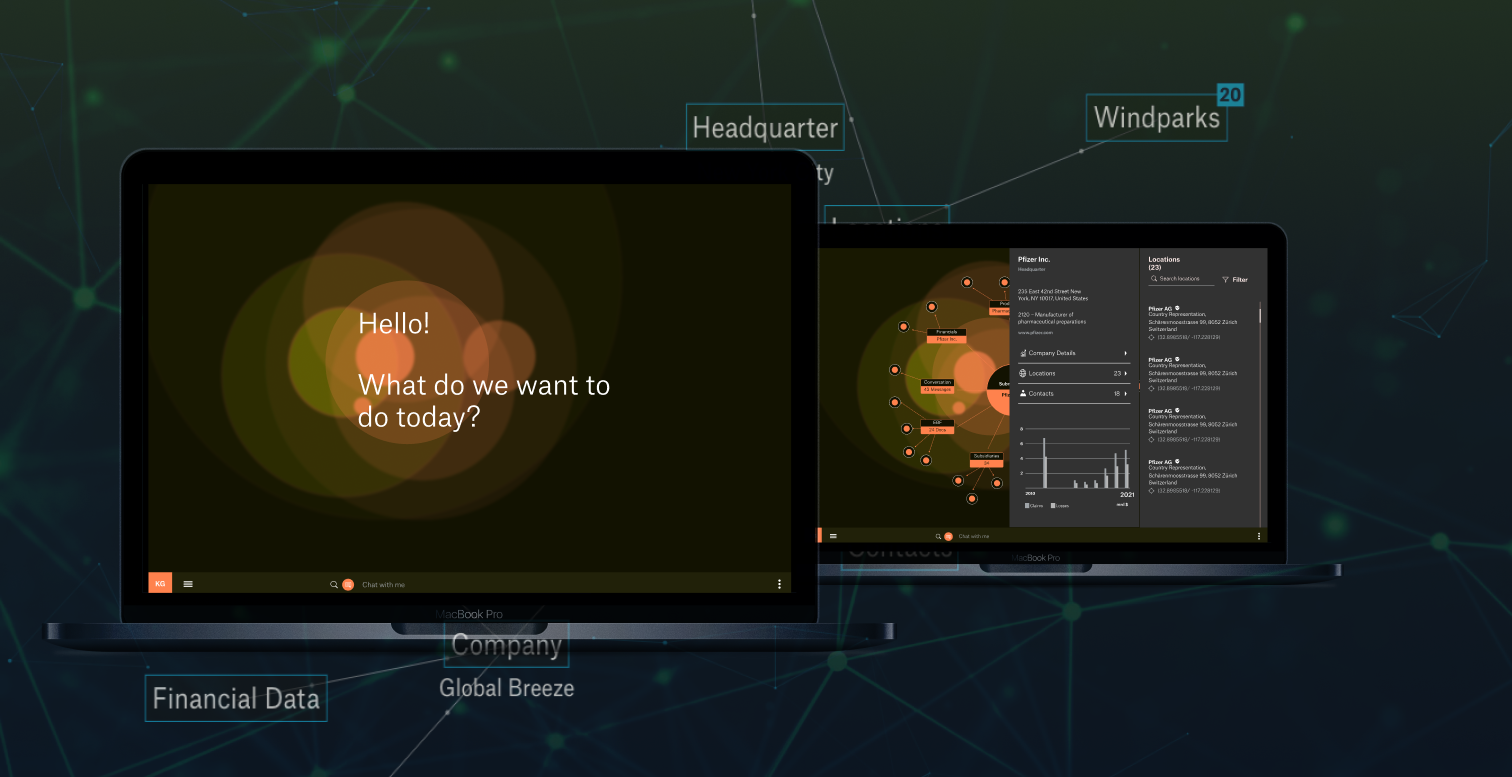
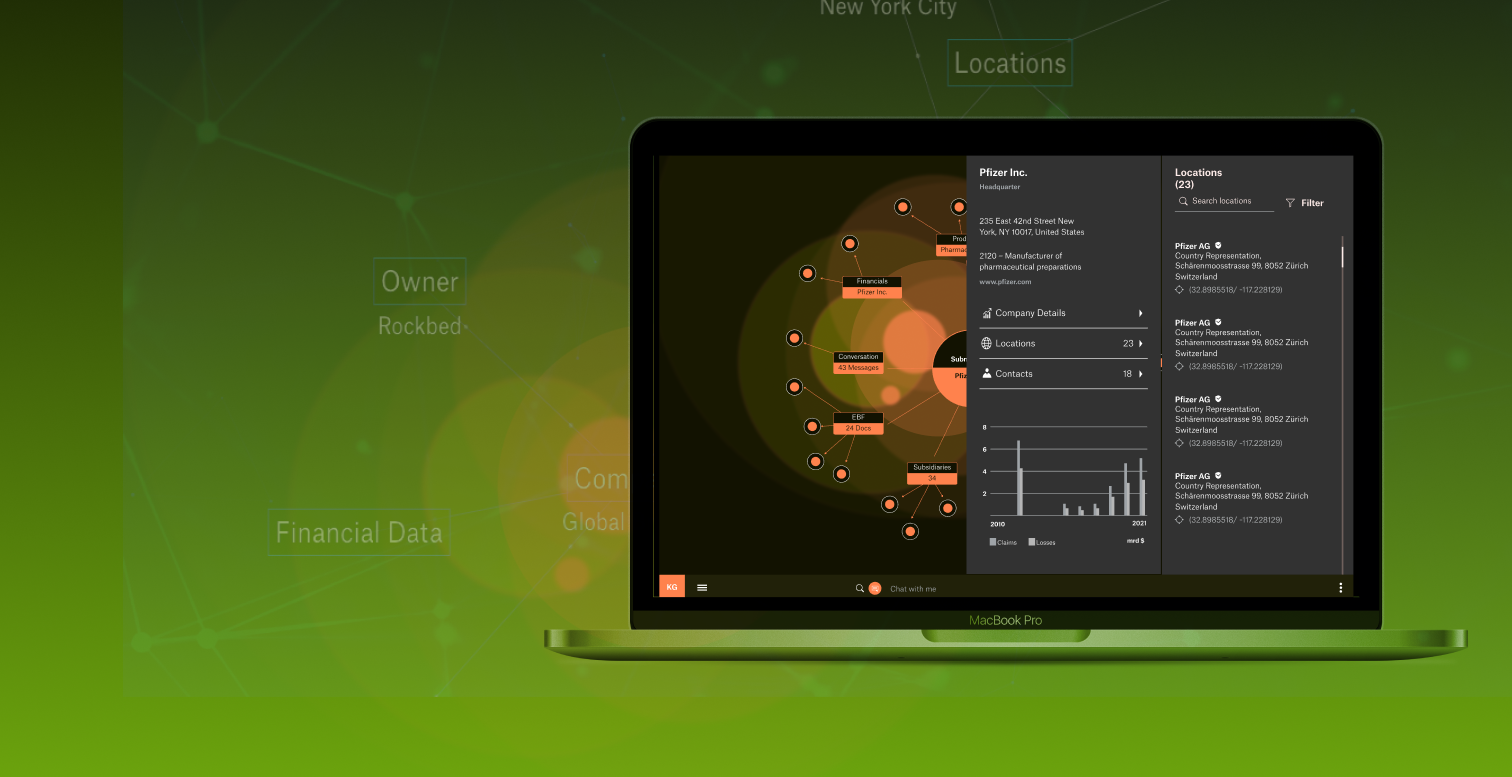
We recognized that complexity assistance was the key fascination for users. While graph visualization looks impressive, with data clouds moving across the screen, it often provides limited practical value as it merely represents overwhelming complexity. Instead, we found that combining with chat interfaces proved more effective. Under the motto "speak to your data and the data speaks back," we had positive experiences with chat interfaces even before the breakthrough of current LLM models like ChatGPT.

Project Successes
The project succeeded on multiple levels:
Prototypical scenarios enabled realistic demonstration of future tools and technologies
All participants could exchange goals, requirements, and expectations while viewing prototypes
Resulting discussions and decision-making processes differed significantly from classical procedures
Tangible Outcomes
Generated more insights through prototypical and explorative work than other possible formats
Produced concrete results dealing with use cases instead of abstract concepts and studies
Simulated technology impact realistically enough to inform decisions about planned deployment
Conclusion and Lessons Learned
The project underscored the importance of exploring the task's full scope. The original goal of designing a knowledge graph interface expanded to investigate the usability and value of this technology under realistic conditions.
Lessons Learned
Our developed interfaces, particularly the chat interface, became a core element in applications processing knowledge. Despite certain drawbacks, the chat interface has proven valuable due to its simplicity; users can ask questions directly instead of navigating complex interfaces. This approach benefits users who know their goals, though it may still challenge those exploring new possibilities. The project demonstrates the importance of maintaining openness toward task exploration. The original goal of designing an interface for a Knowledge Graph was successfully expanded to explore this technology's core questions, usability, and practicality under realistic conditions.
Your Path Forward
Don't let valuable insights remain locked away in complex databases. We can help you:
Assess your current data architecture and identify quick wins
Develop user-centric prototypes tailored to your specific use cases
Create intuitive interfaces that make complex data accessible to all stakeholders
Build a roadmap for implementing knowledge graph technology in your organization
Take the First Step
Ready to unlock the full potential of your organization's data? Contact our team to schedule a discovery workshop.